GSoC 2025: Improving the Netjsongraph.js Visualization Library
Published on by Yashaswi Kumar
Category: gsoc
Participating in Google Summer of Code has truly been a transformative journey. Over the past three months, I had the privilege of working with OpenWISP on enhancing the netjsongraph.js visualization library, an experience that pushed me to grow not only as a developer but also as an openSource contributor.
With the constant guidance, encouragement, and expertise of my mentors Federico Capoano, Nitesh Sinha and Gagan Deep, I was able to dive into new technologies, tackle complex challenges, and implement features that meaningfully improve usability, navigation, and resiliency in network visualization tools.
Their insightful feedback, patience, and unwavering support created the perfect environment for learning and innovation. This mentorship has been instrumental in shaping my ability to approach problems thoughtfully, contribute effectively, and embrace the collaborative spirit that makes openSource communities thrive.
Google Summer of Code with OpenWISP has been nothing short of inspiring, and I'm deeply grateful for the opportunity to contribute, learn, and grow through this experience.
About the Project
The project focused on enhancing netjsongraph.js, a powerful JavaScript library for visualizing network topologies. The primary goal was to improve the library's functionality, user experience (UX), and resiliency, making it more robust and capable for complex, real-world applications like those in OpenWISP. The work involved implementing several key features, from preventing visual clutter on maps to adding new data visualization capabilities and hardening the library against invalid data.
The experience presented significant technical challenges that deepened my understanding of libraries like Leaflet.js, ECharts, and netjsongraph.js, while also offering opportunities to collaborate with the open-source community and contribute to a project with global impact.
Building the NetJSONGraph.js Enhancements
My contributions focused on making the visualization more intuitive and robust. I added features like preventing overlapping clusters, displaying connected clients, zoom dependent labels, and improved resiliency against invalid data. These improvements help users manage complex network visualizations more effectively and troubleshoot issues with ease.
Technical Approach
The enhancements were built using JavaScript, with heavy reliance on Leaflet for mapping, ECharts for graphing, and custom algorithms for clustering and placement. I refactored parts of the codebase to unify data handling between GeoJSON and NetJSON formats, ensuring features work seamlessly across different data sources.
Features Implemented
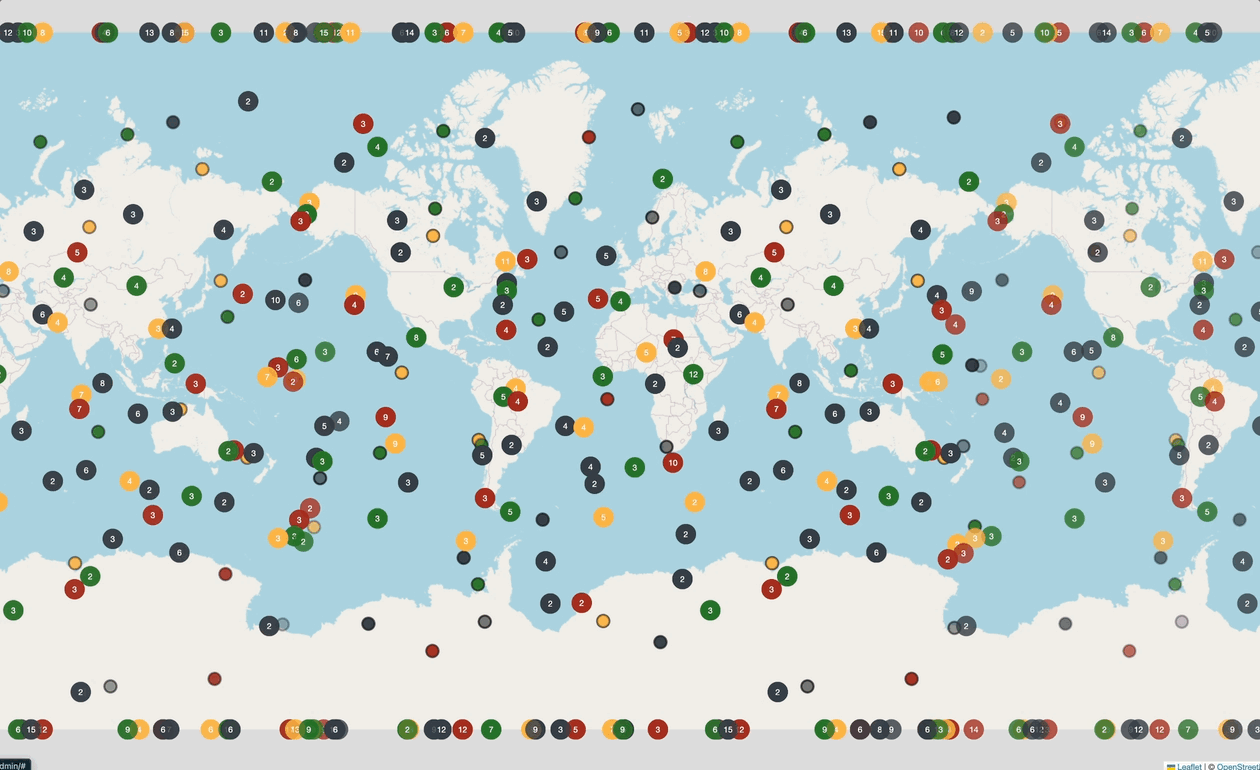
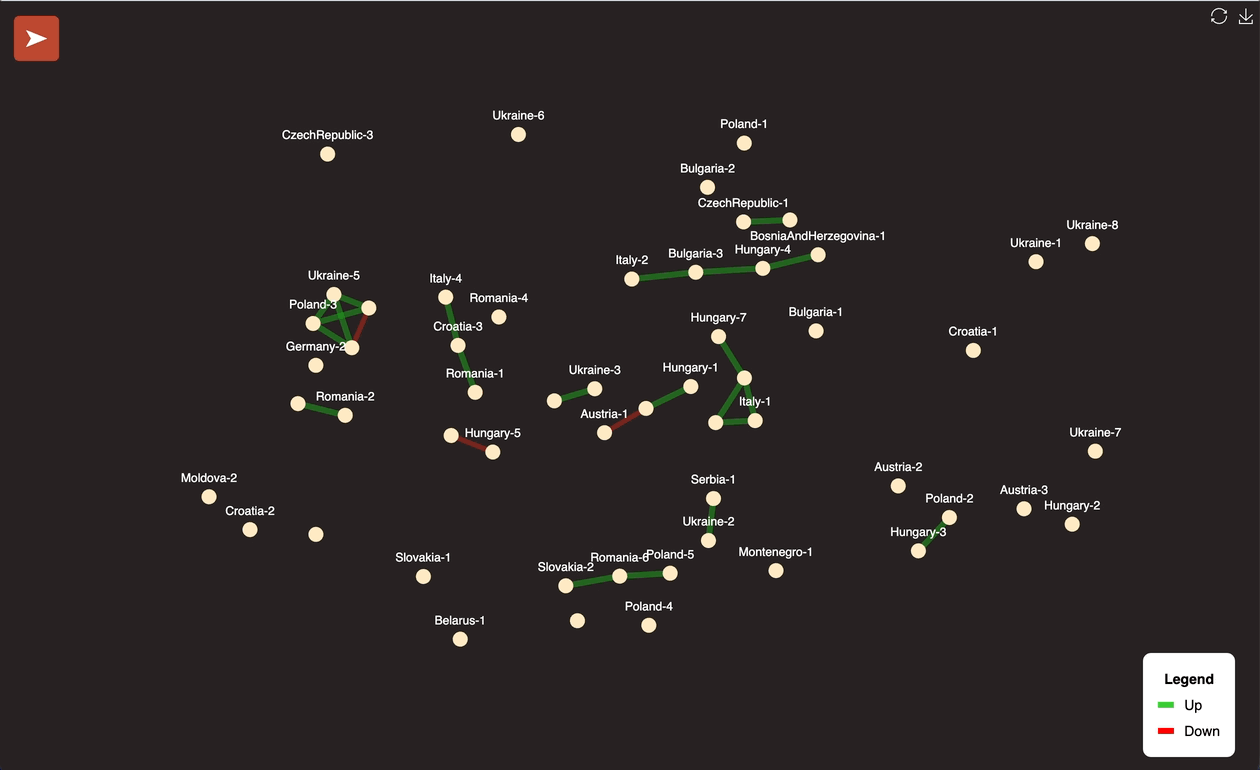
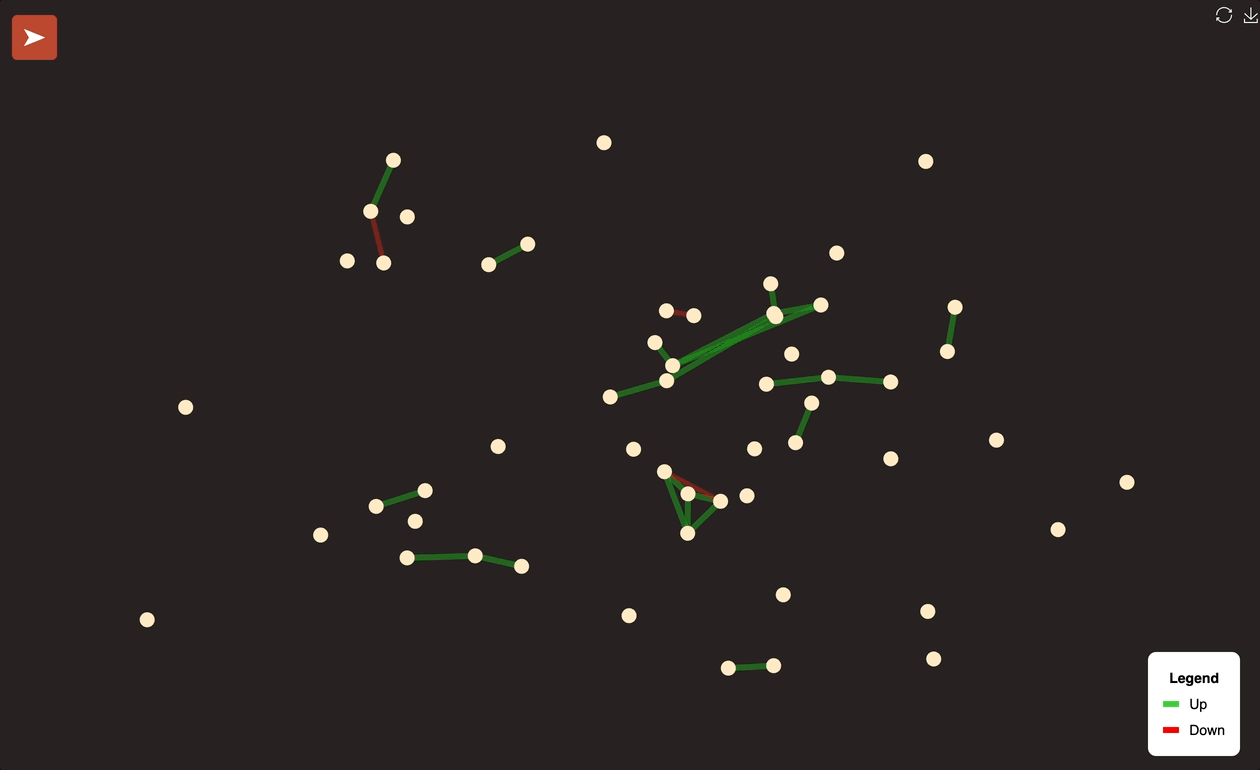
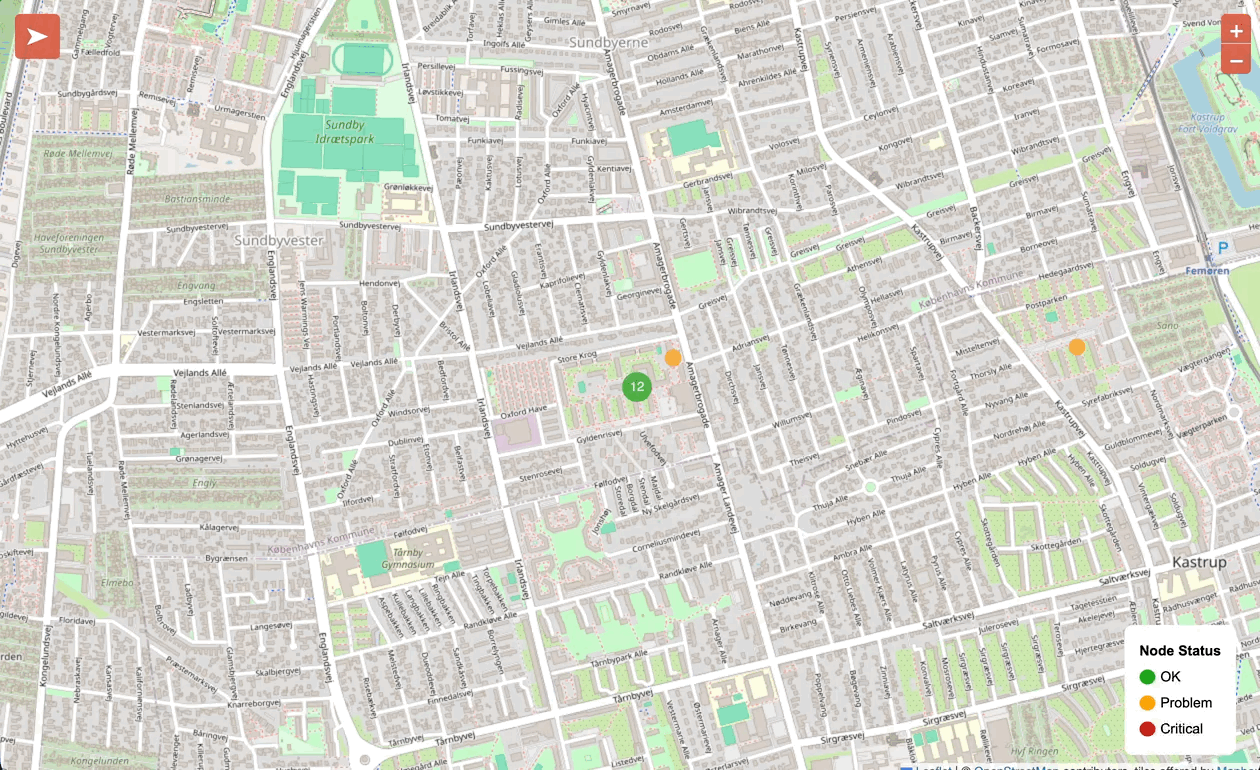
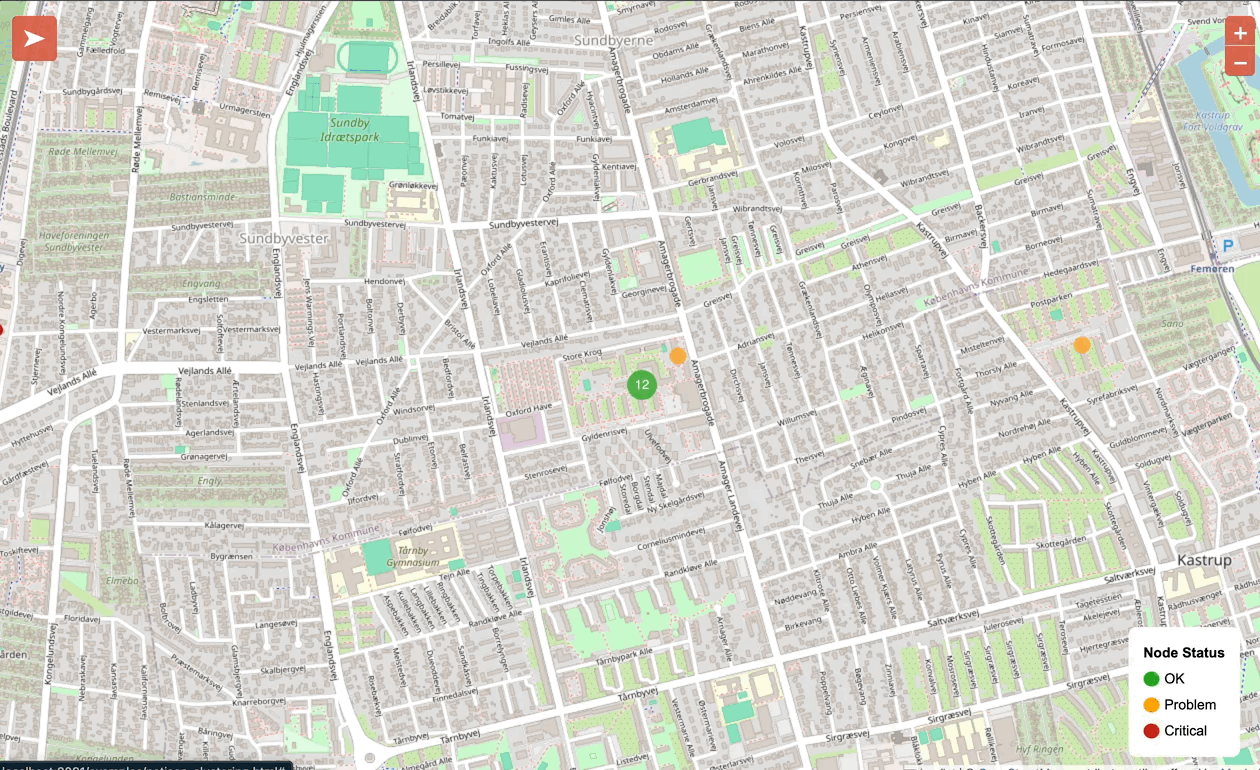
[feature] Added Cluster Prevention Mechanism
This was the main goal of the project, designed to solve a critical issue where overlapping clusters would not show all other clusters clearly.
Before:
After:
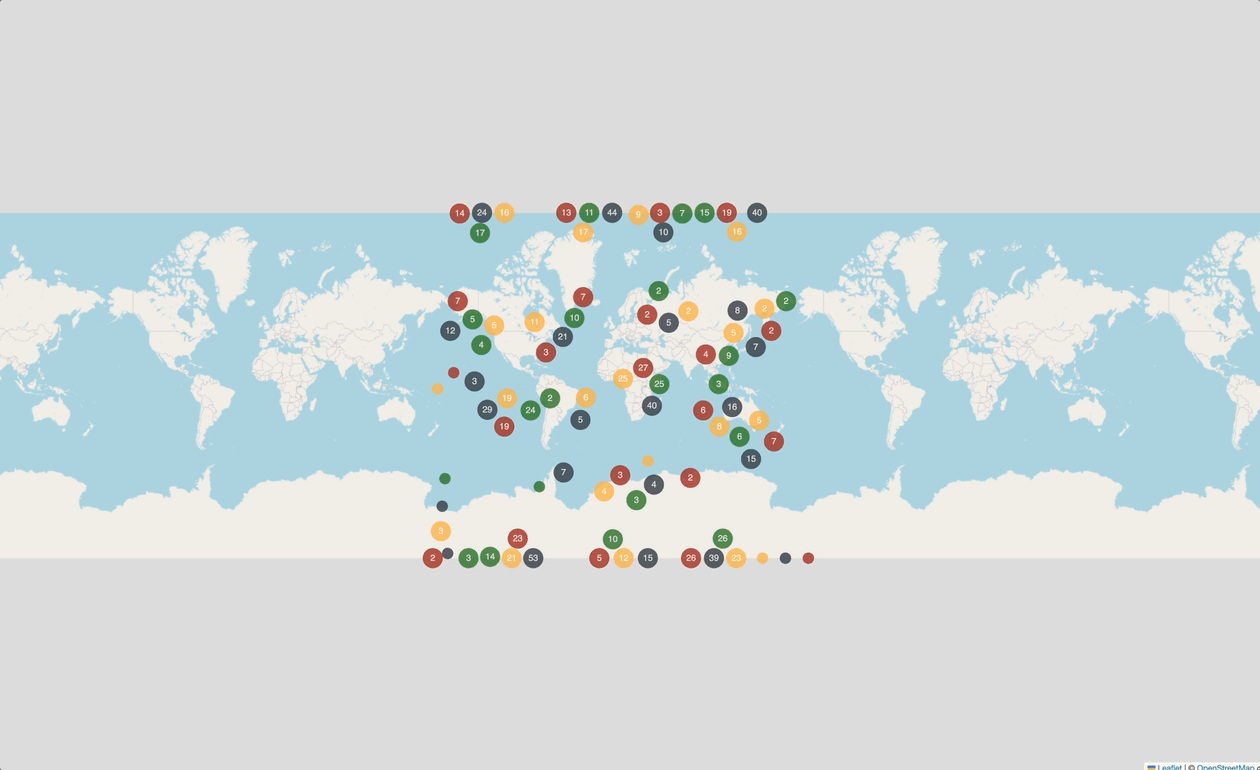
The Problem: When node clusters were at the same location, you couldn't see the different status types (like "ok" vs "critical").
The Solution: I built a clustering system with four key components:
- Data Conversion: Created a converter that works with both GeoJSON and NetJSON formats.
- Clustering: Used KDBush to group nearby nodes based on their status.
- Layout: Added code to place clusters in a circle to prevent overlap.
- Spacing: Added forces between clusters to keep them properly spaced.
[feature] Added Client-Nodes Functionality
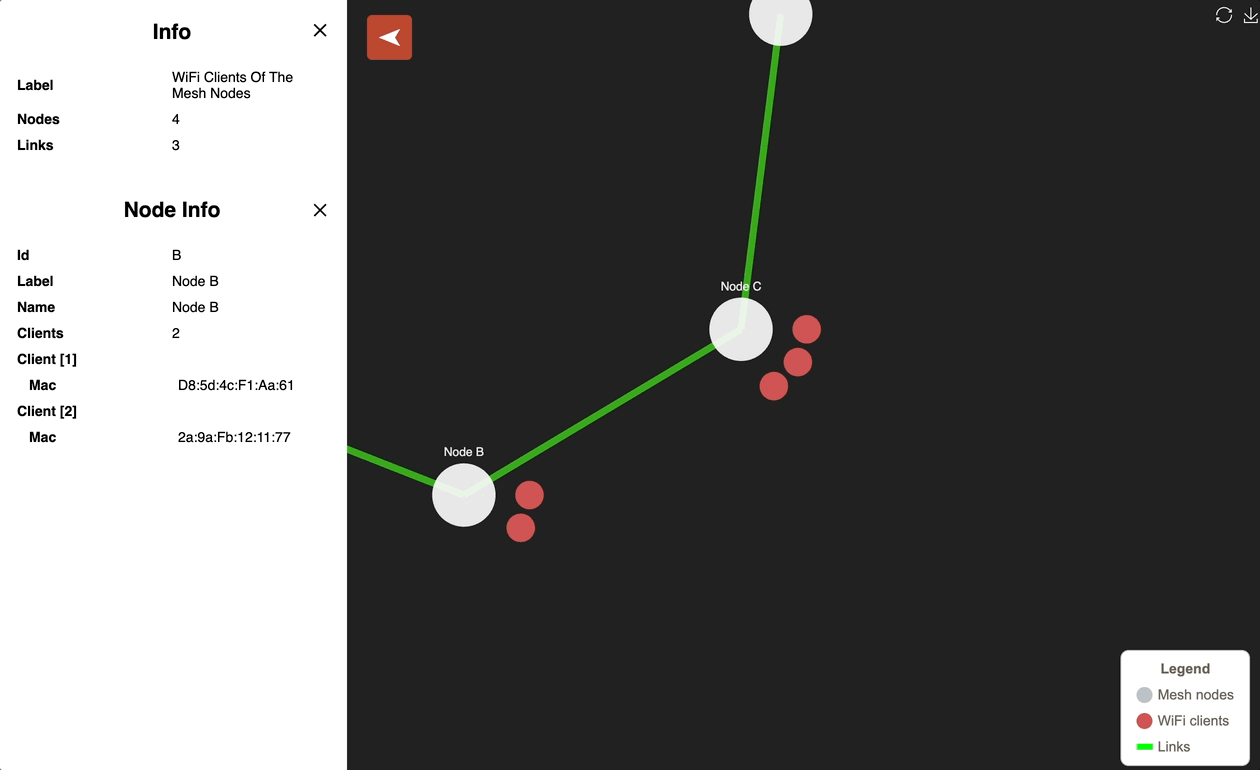
The Problem: The library lacked a built-in, flexible way to visualize secondary data points on nodes, such as the number of connected WiFi clients.
The Mechanism & Logic: I developed this feature as a modular overlay in src/js/netjsongraph.clients.js.
Public API: The feature is exposed via an easy-to-use attachClientsOverlay method.
Orbital Placement Algorithm: To display clients, I implemented a spiral algorithm that places dots in expanding concentric rings. The number of dots per ring is calculated dynamically based on its circumference.
GUI Integration: The sidebar was enhanced to recursively render nested data, allowing it to display detailed information for each client (e.g., MAC address).
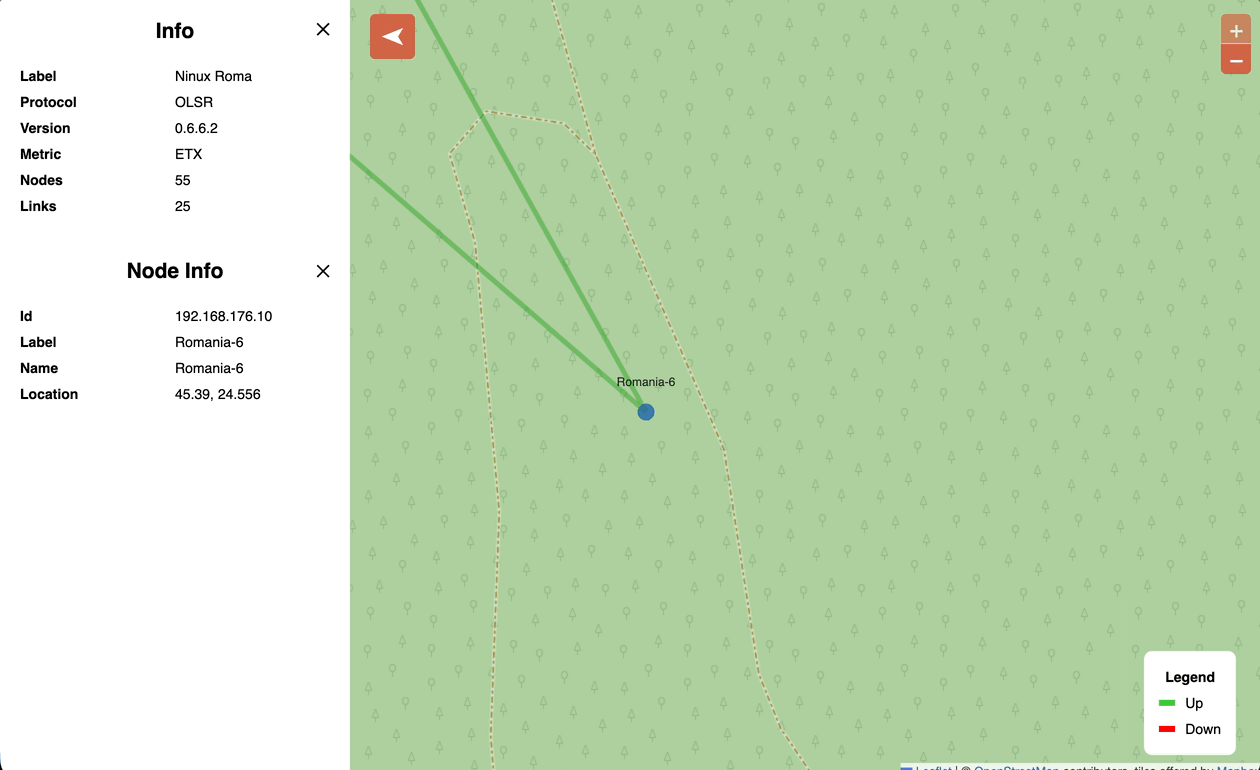
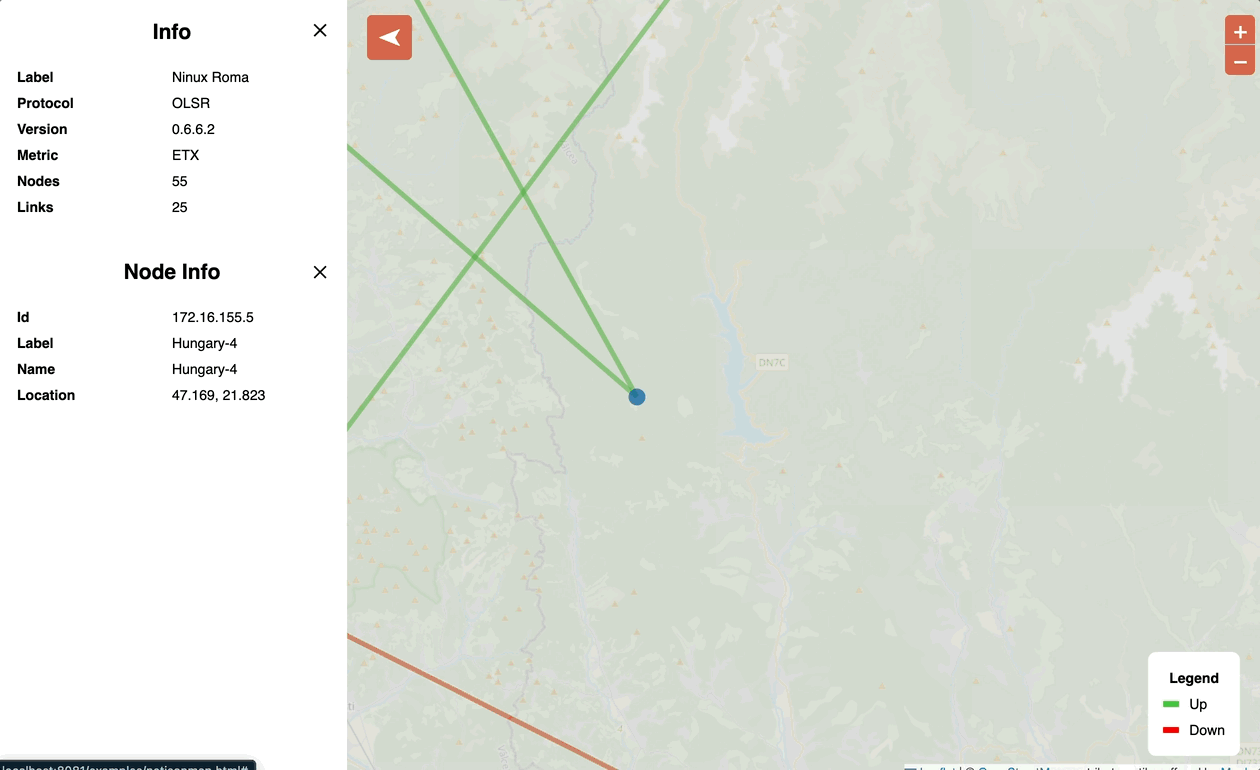
[feature] Add option to show node labels only after hitting a certain zoom level
The Problem: In both map and graph views, displaying all node labels simultaneously at low zoom levels results in a cluttered and unreadable visualization.
The Mechanism & Logic: I introduced showLabelsAtZoomLevel (for maps) and showGraphLabelsAtZoom (for graphs).
Map Mode: The solution uses the Leaflet zoomend event to dynamically update the ECharts series.
Before:
After:
Graph Mode: The solution uses the ECharts graphRoam event and a custom label formatter function.
Before:
After:
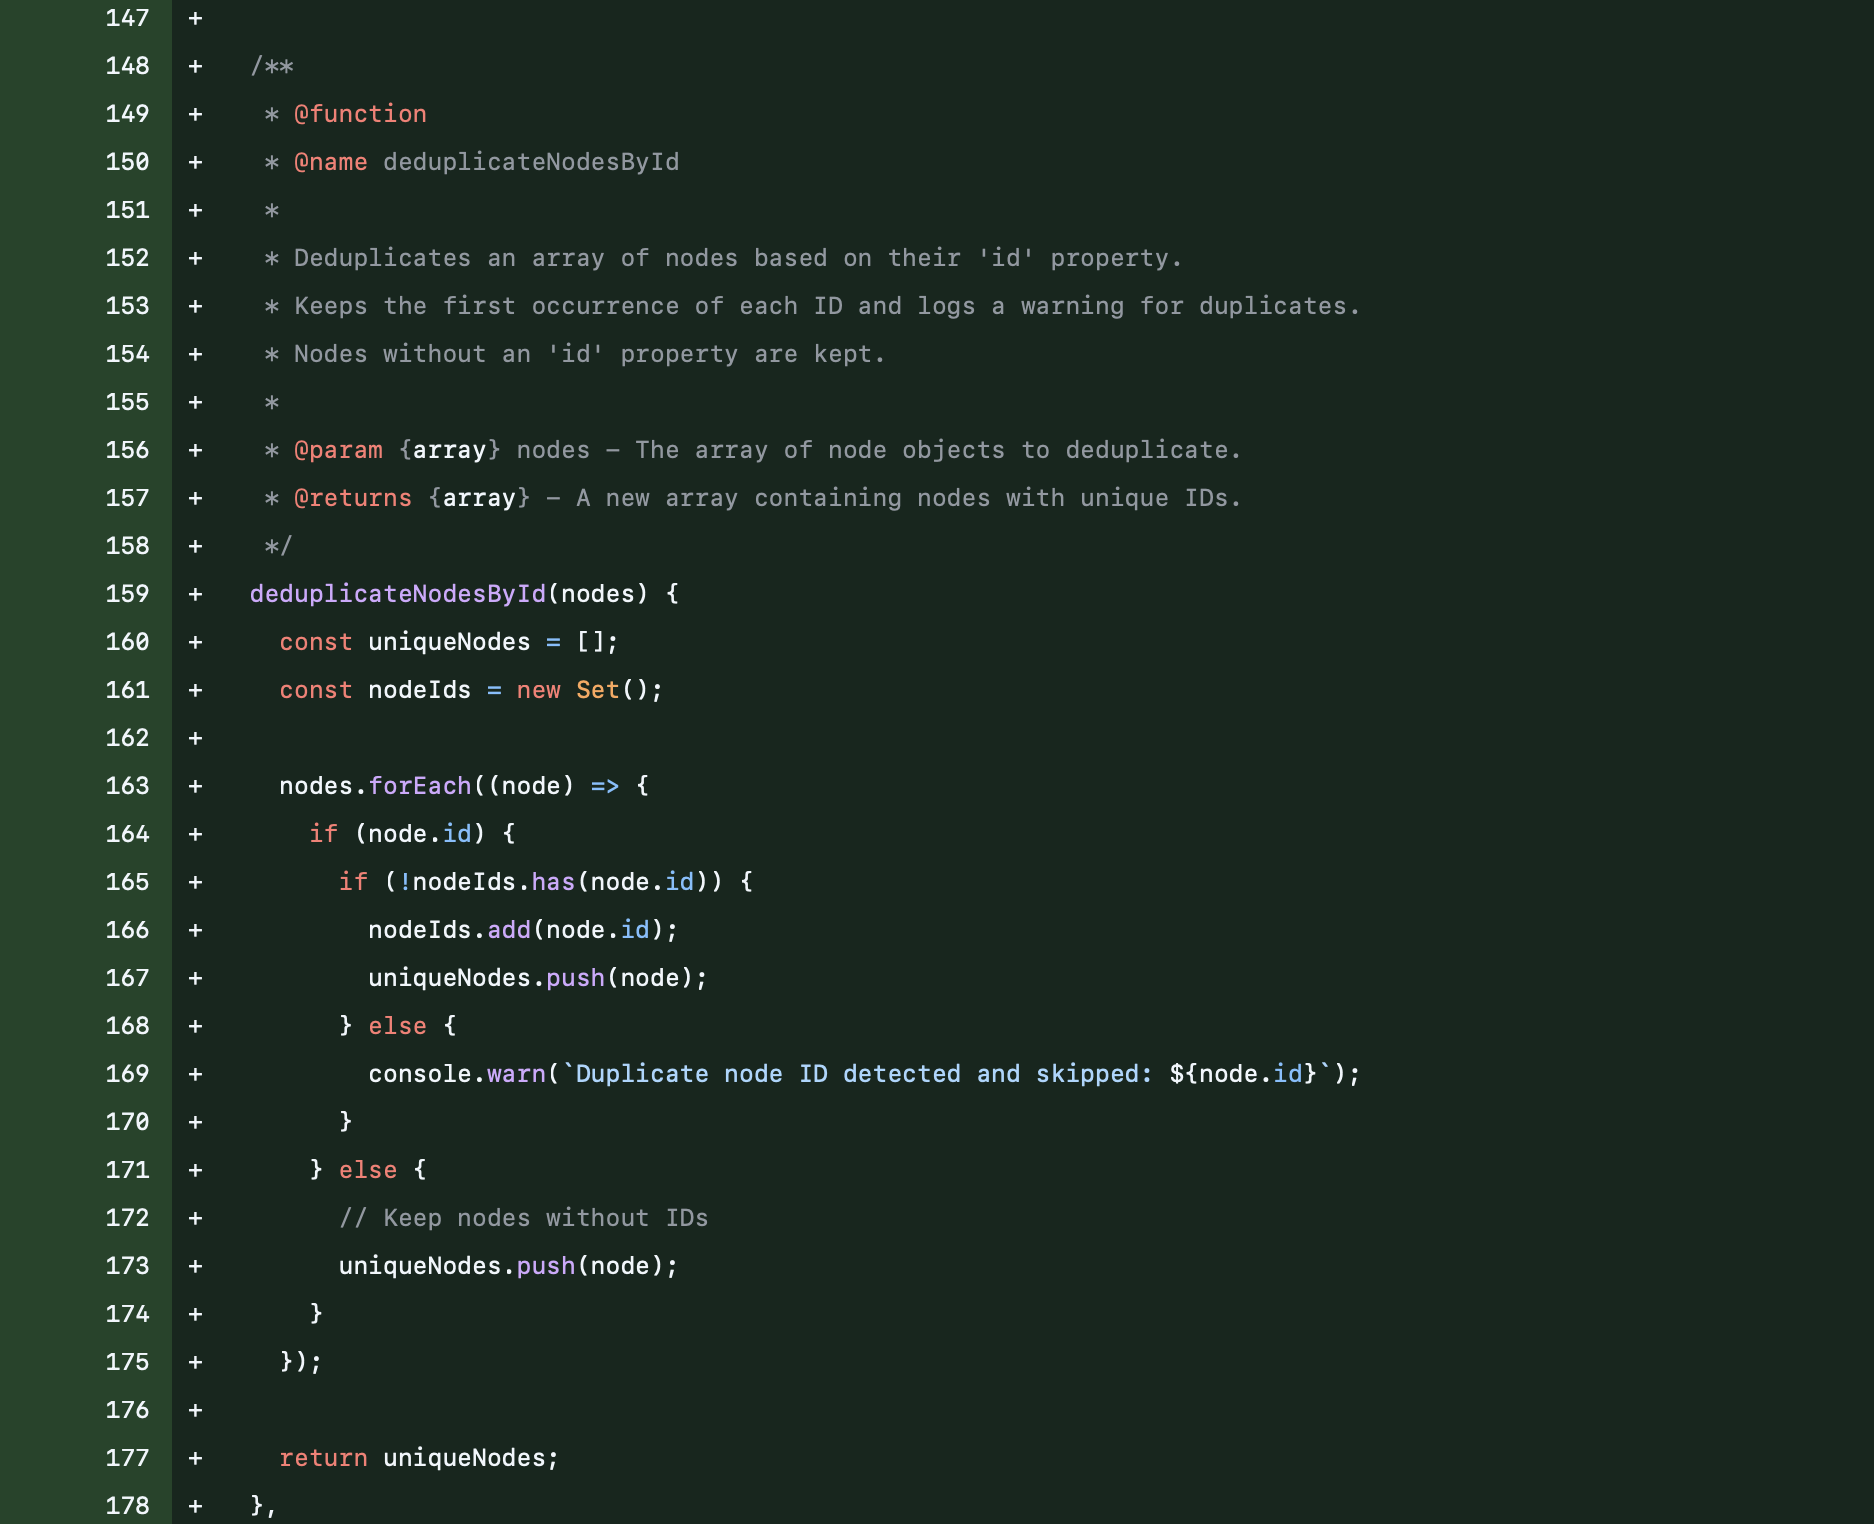
[fix] Fixed duplicate node ID handling
The Problem: The library crashed when duplicate node IDs were present in the data.
The Mechanism & Logic: I used a "defense-in-depth" strategy to prevent crashes from invalid data. The core logic is a new deduplicateNodesById utility.
The Solution: I added a new deduplicateNodesById utility to the library.
[fix] Limit default max zoom level on mapOptions
The Problem: The map showed blank tiles when the max zoom level was exceeded the value higher than the tile provider's max zoom level.
The Mechanism & Logic: I corrected the map's behavior to respect tile provider limits and added CSS for visual feedback on the zoom controls.
Before:
After:
Current state
Over the course of the GSoC program, all proposed objectives were successfully completed and merged into the main branch. The result is a more readable, functional, and resilient library that offers a significantly improved experience for both developers and end-users.
You can follow the development process and explore the implementation details in the following pull requests:
[feature] Added Cluster Prevention Mechanism
Developed a sophisticated algorithm to visually separate data clusters that share the same geographic location but belong to different categories, solving a major data visibility issue.
[feature] Added Client-Nodes Functionality
Implemented a flexible, modular overlay to display the number of connected clients as dots orbiting each node, with a highly efficient placement algorithm.
[feature] Add option to show node labels only after hitting a certain zoom level
Added options to show node labels only when the user zooms past a certain threshold, decluttering the view for both map and graph modes.
[fix] Fixed duplicate node ID handling
Hardened the library against data with duplicate node IDs. It now handles this issue gracefully by deduplicating nodes and logging a warning instead of crashing.
[fix] Limit default max zoom level on mapOptions
Fixed the map's zoom behavior to honor the minZoom and maxZoom limits of the active tile provider, improving the user experience with visual cues on the zoom controls.
[change] Update README demos and add example GIFs
Reorganized and expanded the README demo section with clickable GIF previews for each example, replacing the previous text-only demo list. Added new GIF files to docs/gifs to visually showcase features and usage scenarios.
[fix] Update layout styles for netjsongraph legend example
Added styles to set html and body to full width and height, removed scroll overflow from #container, and set its position to absolute. This improves the layout and ensures the legend example uses the entire viewport.
[fix] Avoided Using Global CSS
Scoped all CSS rules in src/css/netjsongraph.css under the .netjsongraph-container class to avoid global style leakage. Modified src/js/netjsongraph.core.js to add .netjsongraph-container class to the graph container element and apply full-page styling only when the graph is rendered directly in the <body> element.
My Experience
My GSoC journey with OpenWISP has been highly rewarding. Under the mentorship of Federico Capoano, Nitesh Sinha and Gagan Deep, I enhanced the netjsongraph.js library with features like cluster separation, client overlays, and zoom-dependent labels.
The most challenging aspects included developing the circular separation algorithm and unifying data pipelines, which deepened my understanding of Leaflet.js and data handling techniques. The community engagement and final push toward program completion taught me valuable lessons in time management and perseverance.
What's Next?
I'm committed to continuing my contributions to OpenWISP by refining implemented features, addressing community feedback, and exploring additional optimizations. I look forward to maintaining the features I've developed and helping other contributors while remaining an active member of the OpenWISP community.